Featured articles
Changes in fish consumption with the X-Press Pearl disaster, Ilmi Lokugamage & Udani Gunawardana, July 21, 2021
Economic impact from the fisherman to the consumer, Hasini KKL, July 02, 2021
Changes in fish consumption with the X-Press Pearl disaster, Ilmi Lokugamage & Udani Gunawardana, July 21, 2021
Economic impact from the fisherman to the consumer, Hasini KKL, July 02, 2021
|
Changes in fish consumption with the X-Press Pearl disaster
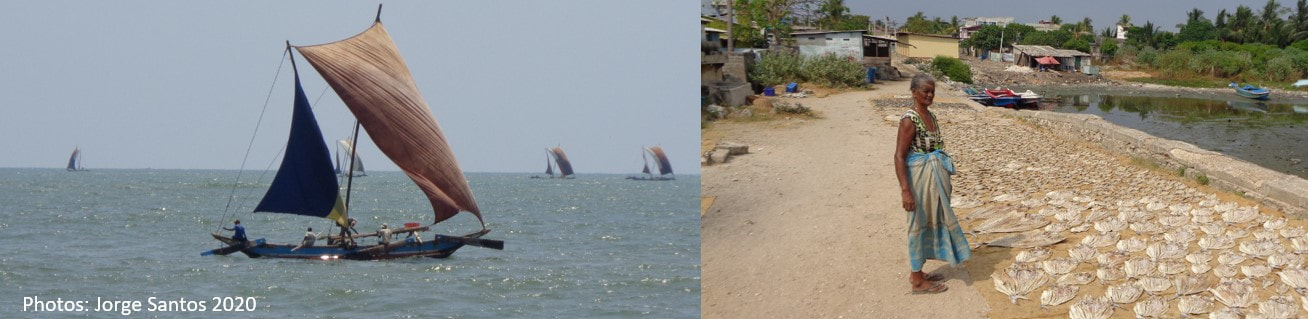
Ilmi Lokugamage & Udani Gunawardana July 21, 2021 Reviewer: Jorge Santos Sri Lanka, being blessed with the magnificent blue ocean around the country, possesses a marine fisheries industry accounting for 81% of the total fish consumption [1]. Fish is the major protein source that provides 55% of the total animal protein requirement of Sri Lankans [1]. However, the X-Press Pearl disaster affected the marine fisheries industry of Sri Lanka. Past studies in the world reveal that oil spills result in negative consumer perceptions regarding safety of fish [2] and reduced fish consumption [2, 3]. Therefore, we made efforts to understand the changes in fish consumption with the X-Press Pearl shipwreck by collecting data from 125 consumers through an online survey using convenience sampling method. With the X-Press Pearl disaster 29% respondents in the sample have reduced fish consumption while approximately half of the sample (48%) have completely stopped eating fish. However, this shipwreck has not influenced the regular fish consumption patterns of 23% consumers in the sample. Most of the respondents (39) have changed their fish consumption within less than one week from the accident followed by (28) respondents who have changed consuming fish from the day of the accident happened. The table 1 shows that the majority of the consumers have perceived that they changed fish consumption due to lack of safety, quality of fish and uncertainty of the area fish caught. When comparing groups of observations we used a statistical test called “paired t-test”. If the differences between the groups of people were clearly not random, but had a clear cause, we could conclude, using statistical methods, that the differences were “significant”. It was found that there are “significant” differences in the household fish consumption of respondents before and after the X-Press Pearl wreck in terms of number of days per week fish consumed, amount of grams of fish consumed per week and amount of Rupees spent on fish per week (Table 2). The average reductions in household fish consumption vary between 60-66% accounting for 66%, 64% and 61% decrease in respective to the number of days fish consumed per week, amount of grams consumed per week and amount of rupees spent on per week accordingly when compared to the consumption before this disaster. Further, attempts were made to identify the changes in fish consumption patterns of the highly affected Districts by considering the respondents of the sample from Gampaha, Colombo and Kalutara. Similarly, it was found that that there are “significant” differences in the household fish consumption of the respondents in the highly affected area before and after the incident based on the number of fish consumption days per week, amount of grams of fish consumed per week and amount of Rupees spent on fish per week (Table 2). However, when compared to the average decreased household fish consumption percentages of the total sample, higher reduced percentages are reported for the respondents living in the highly affected area resulting for a 71% reduction in number of days fish consumed per week, 74% decrease in amount of fish consumed per week and 67% fall in amount spent on fish per week. As the X-Press Pearl disaster has reduced the demand for marine fish, we made attempts to identify the substitute goods used by respondents who have changed consuming marine fish. Eggs (95%) and chicken (78%) are the mostly utilized substitutes. In addition, soya meat (54.3%), dry fish (32%), canned fish (26%) and other sources i.e. mushroom, inland fish and cereals (5%) are also used. Results revealed that the majority (79) of respondents, who have changed eating fish, do not have any idea about the exact time period they are going to restart consuming fish as they usually did. But interestingly more than three quarter of the respondents in the sample (86%) who have changed their general patterns of eating fish, are willing to get back to their usual consumption patterns, if scientifically studies prove about the safety of fish. This is a clear call from the Sri Lankan consumers who want to return to the consumption of wild fish, which is an excellent protein source and low in ecological footprint. References [1] Needham, S. and Funge-Smith, S. J. (2014).The consumption of fish and fish products in the Asia-Pacific region based on household surveys. FAO Regional Office for Asia and the Pacific, Bangkok, Thailand. RAP Publication 2015/12. 87pp. [2] McKendree, M.G., Ortega, D.L., Widmar, N.O. and Wang, H.H., (2013). Consumer perceptions of seafood industries in the wake of the Deepwater Horizon oil spill and Fukushima Daiichi nuclear disaster, Michigan State University, Department of Agricultural. Food, and Resource Economics. [3] Estevo, M.O., Lopes, P.F.M, Júnior, J.G.C.O., Junqueira, A.B., Santos, A.P.O., Lima, J.A.S., Malhado, A.C.M., Ladle, R.J. and Campos-Silva, J.V., (2021). Immediate social and economic impacts of a major oil spill on Brazilian coastal fishing communities. Marine Pollution Bulletin, 164, p.111984. DOI: 10.1016/j.marpolbul.2021.111984 |
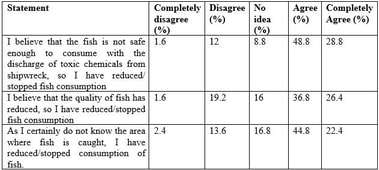
Table 1: Responses to statements
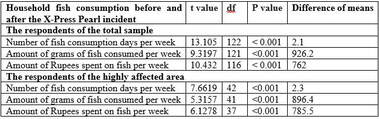
Table 2: Results of the Paired t-tests
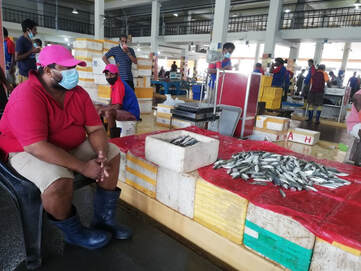
Figure 1: A fisher folk at his fish stall in Peliyagoda fish market struggling to sell fish (Source: Aljazeera)
|
|
Economic impact from the fisherman to the consumer Hasini KKL July 02, 2021 Reviewer: Jorge Santos Coastal fishing activities have been banned across 80 km of coastline from Panadura to Negombo following the MV X-Press Pearl accident. The Negombo fisheries district has rich coastal and lagoon fishing grounds and it contributed around 6.6% of the total annual marine fish production of the country in 2019 [1]. As a result of the regional fishing ban, the value chains structures were deformed, and economic flows may be broken down. So far, it seems that almost all fishers of the district have lost their livelihood, and this has also affected the regional economic agents who are involved in fish marketing and distribution activities. It is crucial to estimate this economic impact to adequately compensate the industry stakeholders and to effectively plan the value chain rehabilitation strategies. I have performed a rapid, pilot study, based on my previous works on fisheries value chains [2]. I choose fisheries value chains targeting five species in the Negombo fisheries district. The baseline for this analysis are pre-corona conditions. It was assumed that 7564 coastal fishers and 920 fish vendors in Negombo were economically affected [3]. I considered the most common form of the value chain structure (Figure 02). The net profit along each value chain was calculated using a formula, 'Net Profit = Market Margin- Marketing Cost' [4]. The net profit was imputed as a net loss to quantify the impact of the imposed fishing ban. The losses of each economic agent in the value chain varied widely with species and gear/craft type (figure 3). The highest total loss (1053 LKR/kg) was in the shrimp value chain whereas the lowest net loss (61 LKR/kg) was in the Sardine value chain. Fishers of the shrimp value chain have the highest net loss (381 LKR/kg). Wholesalers of the Sardine value chain have the lowest net loss (14 LKR/kg). Fishers have high losses compared to other agents for medium valued species such as Trenched sardine and Indian Mackerel. Fish vendors incur the highest loss compare to other agents in the value chains of high valued species. The total economic loss was estimated considering the average daily production of the district. The Trenched sardine fishery that lands about 15 tons was the most affected, with about six million rupees daily loss. This was followed by the losses of Indian mackerel (two million rupees), sardine (700K rupees) and tuna (200K rupees). The economically least affected was the shrimp fishery, with a daily loss of 74 kg corresponding to 77K rupees in the value chain. This analysis compares the economy before corona with that after the fisheries ban, which was assumed to result in a total stop of the regional industry. This may not have been the case, as some value chains may have kept functioning or the products replaced. The purpose was to highlight that not only the fishers suffer large losses along the vertical value chain to the consumer. The losses incurred in horizontal value chains, which have multiplier effects, will be highlighted in another article. References [1] MFARD (2018). Fisheries Statistics 2020, Maligawatta, Colombo 10. https://www.fisheriesdept.gov.lk/web/images/Statistics/FISHERIES-STATISTICS--2020-.pdf [2] Hasini, K.K.L., De Silva, W.N. and Santos J. (2020). Small Pelagic Fish Value Chain and Its Contribution to Local Food Security: A Case Study in Gandara Fishing Village in Southern Coast of Sri Lanka. Tropical Agricultural Research, 31(3): 60- 71. [3] DFAR (2012 a). Rapid fisheries frame survey report of coastal and brackish water fisheries in the fisheries district of Negombo. Regional Fisheries Livelihoods Program for South and Southeast Asia (GCP/RAS/237/SPA): Field Project Document 2012/LKA/CM/01. http://www.fao.org/3/a-ar453e.pdf [4] Phiri, L. Y., Dzanja, J., Kakota, T. and Hara, M. (2013) ‘Value Chain Analysis of Lake Malawi Fish : A Case Study of Oreochromis spp ( Chambo )’, International Journal of Business and Social Science, 4(2), pp. 170–181. |
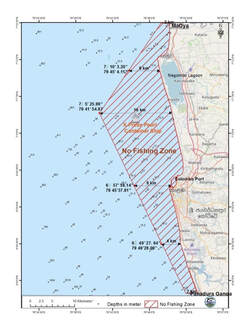
Figure 1: Map of the no fishing zone (Source: the morning)

Figure 2: Generic fisheries value chain
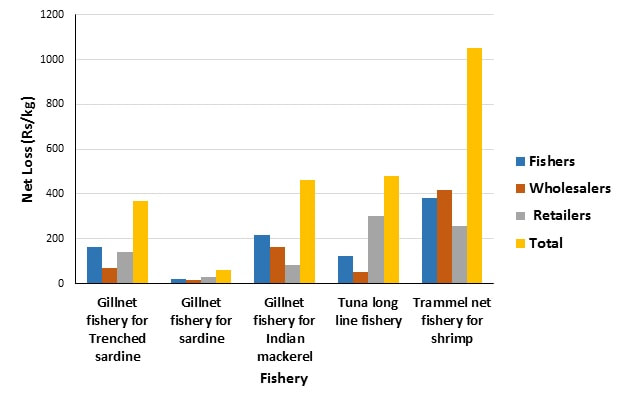
Figure 3: Comparison of the net loss among different nodes of the value chains
|
